Top 10 container throughput of ports worldwide in 2024
Date:2025-03-19
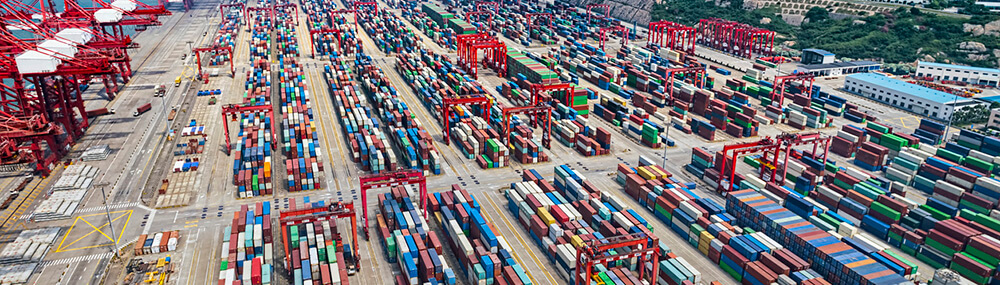
In 2024, global container throughput reached 183.2 million TEUs, marking a 6% year-on-year increase. Among different regions, North America saw the fastest growth in imported container volumes, rising by 12%. East Asia accounted for the largest share of global export container volumes, contributing 61%, with the primary export destinations being North America and Europe. The active Trans-Pacific and Asia-Europe routes have fueled rapid growth for Asian ports.
The container throughput ranking of the world’s top 10 ports in 2024 has been released, here are the top 10 container ports worldwide in 2024:
Rank
Port
Nation
2024 MTEUs
2023 MTEUs
Growth Rate
1
Port of Shanghai
China
51.5
49.16
4.76%
2
Port of Singapore
Singapore
41.12
39.01
5.40%
3
Port of Ningbo-Zhoushan
China
39.3
35.3
11.33%
4
Port of Shenzhen
China
33.39
29.88
11.75%
5
Qingdao Port
China
30.87
28.75
7.30%
6
Port of Guangzhou
China
26.45
25.41
4.07%
7
Busan Port
South Korea
24.4
22.75
5.38%
8
Port of Tianjin
China
23.29
22.19
4.97%
9
Port of Jebel Ali
United Arab Emirates
15.53
14.47
7.31%
10
Port Klang
Malaysia
14.64
13.85
4.12%
The top five ports each handled more than 30 million TEUs. All ten ports experienced positive growth last year, with Ningbo-Zhoushan Port and Shenzhen Port achieving double-digit growth. Shenzhen Port had the highest growth rate at 11.78%, partly due to a decline in throughput in 2023.
In terms of volume increases, the top five ports each saw an increase of over 2 million TEUs. Ningbo-Zhoushan Port recorded the largest volume growth, adding a staggering 4 million TEUs.